Applications

A multi-billion-dollar hydrogen industry currently exists in the United States, serving a myriad of hydrogen end-use applications; however, about 99 percent of that hydrogen currently is used in chemical and petrochemical applications. Of the end uses, the largest consumers are oil refineries, ammonia plants, chlor-akali plants, and methanol plants. Some specific examples of hydrogen end use include:

• Petroleum refining—to remove sulfur from crude oil as well as to convert heavy crude oil to lighter products

• Chemical processing—to manufacture ammonia, methanol, chlorine, caustic soda, and hydrogenated non-edible oils for soaps, insulation, plastics, ointments, and other chemicals

• Pharmaceuticals—to produce sorbitol, which is used in cosmetics, adhesives, surfactants, and vitamins

• Metal production and fabrication—to create a protective atmosphere in high-temperature operations, such as stainless steel manufacturing

• Food processing—to hydrogenate oils, such as soybean, fish, cottonseed, and corn oil

• Laboratory research—to conduct research and experimentation

• Electronics—to create a special atmosphere for the production of semiconductor circuits

• Glass manufacturing—to create a protective atmosphere for float glass production

• Power generation—to cool turbo-generators and to protect piping in nuclear reactors.

Stationary Power Systems

Stationary power applications are widely viewed as a critical sector where there may be an opportunity to expand greatly the future use of hydrogen.

A near-term area of demand for fuel cells includes stationary power applications, such as backup power units, power for remote locations, and distributed generation for hospitals, industrial buildings, and small towns. Stationary fuel cell power systems already are commercially viable in settings where the consumer is willing to pay a small price premium for reliable energy, and in remote areas where fossil fuel transportation costs are prohibitive. To date, approximately 600 stationary power systems, each with 10 kilowatts or more capacity, have been built worldwide; and more than 1,000 smaller stationary fuel cells, less than 10 kilowatts, have been installed in homes and as backup power systems.

Comprehensive data on U.S. stationary fuel cell installations are not available, but the following types of stationary fuel cell applications are under development:

• Large cogeneration (combined heat and power) systems are being manufactured for large commercial buildings or industrial sites that require significant amounts of electricity, water heating, space heating, and/or process heat. Fuel cells combined with a heat recovery system can meet some or all of these needs, as well as providing a source of purified water.

• Small, standalone cogeneration systems currently are viable in some areas where the large cost of transmitting power justifies the added cost of a fuel cell. Currently, U.S. companies (such as Plug Power) manufacture small fuel cell systems that are able to produce up to 5 kilowatts of electricity and 9 kilowatts of thermal energy. The excess heat can be used for water or space heating to further reduce the site’s electrical energy use.

• Uninterruptible power supply (UPS) systems, in which fuel cells are used as backup power supplies if the primary power system fails, are one of the fastest growth areas for stationary fuel cell technologies. UPS systems often are used in important services, such as telecommunications, banking, hospitals, and military applications. Battery systems have been used for many years to provide backup power to essential services; however, the battery output time is relatively short. In contrast, fuel cells with refillable fuel storage systems can provide power for as long as required during a blackout.

• Home energy stations are another variant of small, standalone cogeneration systems. They use either reformers or electrolyzers to produce hydrogen fuel for personal vehicles, and they also incorporate a hydrogen fuel cell that can provide heat and electricity for the home. One advantage of the stations is that they offer enhanced utilization of the hydrogen gas, i.e., higher capacity factors for the hydrogen production unit, and therefore help to defray some of the overall cost of the hydrogen refueling station. Appliance-sized home energy stations are undergoing development by several automobile manufacturers as a potential alternative to commercial refueling stations.

Source: U.S. Energy Information Administration
Storage

Because hydrogen gas has such a low density, and because the energy requirements for hydrogen liquefaction are high, efficient hydrogen storage generally is considered to be among the most challenging issues facing the hydrogen economy. For current chemical applications, storage issues are not so critical, because the large producers of hydrogen both generate and consume the gas simultaneously on site, thereby reducing storage and distribution requirements significantly.

Stationary Storage Systems

Very large quantities of hydrogen can be stored as a compressed gas in geological formations such as salt caverns or deep saline aquifers. There are two existing underground hydrogen storage sites in the United States. In addition, the co-storage of hydrogen with natural gas has been proposed. There are 417 locations in the United States where natural gas is currently stored in rock caverns, salt domes, aquifers, abandoned mines, and oil/gas fields, with a total storage capacity exceeding 3,600,000 million cubic feet. Hydrogen stored in salt caverns has the best injection and withdrawal properties.

Source: U.S. Energy Information Administration

Distribution

Centrally produced hydrogen must be transported to markets. The development of a large hydrogen transmission and distribution infrastructure is a key challenge to be faced if the United States is to move toward a hydrogen economy. A variety of hydrogen transmission and distribution methods are likely to be used. Larger industrial users rely on pipelines and compressors to move the hydrogen gas.

Pipeline Systems

Currently, more than 99 percent of all the hydrogen gas transported in the United States is transported by pipeline as a compressed gas. Pipeline transmission of hydrogen dates back to the late 1930s. The pipelines that carry hydrogen generally have operated at pressures less than 1,000 pounds per square inch (psi), with a good safety record. As of 2006, the U.S. hydrogen pipeline network totaled over 1,200 miles in length, excluding on-site and in-plant hydrogen piping More than 93 percent of the U.S. hydrogen pipeline infrastructure is located in just two States, Texas and Louisiana, where large chemical users of hydrogen, such as refineries and ammonia and methanol plants, are concentrated.

The existing U.S. hydrogen pipeline network is only one-third of 1 percent of the natural gas network in length and has less than 200 delivery points. Also, because of concerns over potential leakage, the hydrogen pipes tend to be much smaller in diameter and have fewer interconnections. Special positive displacement compressors are also required to move hydrogen through the pipelines. The length of hydrogen gas piping tends to be short, because it is usually less expensive to transport the hydrogen feedstock, such as natural gas, through the existing pipeline network than to move the hydrogen itself through new piping systems. Historically, welded hydrogen pipelines have been relatively expensive to construct (approximately $1.2 million per transmission mile and $0.3 million per distribution mile). Consequently, the pipelines have required a high utilization rate to justify their initial capital costs. More recently, polyethylene sleeves and tubing systems have emerged as a possible low-cost alternative solution for new hydrogen distribution systems, with total capital investments for transmission piping potentially dropping to just under $0.5 million per mile (in 2005 dollars) by 2017 and with commensurately lower costs for distribution lines.

How a centralized hydrogen transmission and distribution system will evolve is unknown, and therefore the costs cannot be estimated with a high degree of confidence. The costs will depend on where the pipelines are sited, rights-of-way, pipeline diameter, quality and nature of the pipeline materials required to address the special properties of hydrogen, operating pressures, contractual arrangements with hydrogen distributors, financing and loan guarantees, the locations of dispensing stations relative to distributors, and how applicable environmental and safety issues in the production, transmission, distribution, and dispensing of hydrogen are addressed. Because all hydrogen gas has to be manufactured, hydrogen production facilities may be located in ways that minimize overall production and delivery costs.

Liquid Hydrogen (Cryogenic) Transport

Hydrogen can be cooled and liquefied in order to increase its storage density and lower its delivery cost. There are currently four liquid hydrogen suppliers and seven production plants in the United States with a total production capacity of about 76,495 metric tons per day. Those facilities support about 10,000 to 20,000 bulk shipments of liquid hydrogen per year to more than 300 locations. Most long-distance transfers of hydrogen use large cryogenic barges, tanker trucks, and railcars to transport the liquid hydrogen. NASA is the largest consumer of liquid hydrogen. The chief constraints to widespread use of this hydrogen transportation mode relate to the energy losses associated with liquefying hydrogen and the storage losses associated with boil-off.

Compressed Hydrogen Gas Cylinders

Hydrogen is also distributed in high-pressure compressed gas “tube trailer” trucks and cylinder bottles. This delivery method is relatively expensive, and typically it is limited to small quantities and distances of less than 200 miles.

Alternative Chemical Carriers

Hydrogen also can be transported using hydrogen-rich carrier compounds, such as ethanol, methanol, gasoline, and ammonia. Such carriers offer lower transportation costs, because they are liquids at room temperature and usually are easier to handle than cryogenic hydrogen; however, they also require an extra transformation step, with costs that must be weighed against the cost savings associated with transporting low-pressure liquids. Hydrogen carriers such as methanol and ammonia may also present some additional safety and handling challenges.

Hydrogen Fuel Distribution

The most economical methods for distributing hydrogen depend on the quantities and distances involved. For distribution of large volumes of hydrogen at high utilization rates, pipeline delivery is almost always cheaper than other methods—except in the case of long-distance transportation, e.g., over an ocean, in which case liquid hydrogen transport is cheaper.

Source: U.S. Energy Information Administration

Production

Hydrogen production processes can be classified generally as those using fossil or renewable (biomass) feedstocks and electricity. The technology options for fossil fuels include reforming, primarily of natural gas in “on-purpose” hydrogen production plants, and production of hydrogen as a byproduct in the petroleum refining process. Electrolysis processes using grid or dedicated energy sources, including some advanced techniques that have not yet been proven, also can be used.

On-Purpose Hydrogen Production Technologies

The on-purpose hydrogen production technologies are reforming, partial oxidation (including gasification), and electrolysis. Each process has its own advantages and disadvantages with respect to capital costs, efficiency, life-cycle emissions, and technological progress.

Electrolysis, or water splitting, uses energy to split water molecules into their basic constituents of hydrogen and oxygen. The energy for the electrolysis reaction can be supplied in the form of either heat or electricity. Large-scale electrolysis of brine (saltwater) has been commercialized for chemical applications. Some small-scale electrolysis systems also supply hydrogen for high-purity chemical applications, although for most medium- and small-scale applications of hydrogen fuels, electrolysis is cost-prohibitive.

One drawback with all hydrogen production processes is that there is a net energy loss associated with hydrogen production, with the losses from electrolysis technologies being among the largest. The laws of energy conservation dictate that the total amount of energy recovered from the recombination of hydrogen and oxygen must always be less than the amount of energy required to split the original water molecule. For electrolysis, the efficiency of converting electricity to hydrogen is 60 to 63 percent. To the extent that electricity production itself involves large transformation losses, however, the efficiency of hydrogen production through electrolysis relative to the primary energy content of the fuel input to generation would be significantly lower.

Economics of Hydrogen Production Technologies

The economics of hydrogen production depend on the underlying efficiency of the technology employed, the current state of its development (i.e., early stage, developmental, mature, etc.), the scale of the plant, its annual utilization, and the cost of its feedstock.

Electrolysis technologies suffer from a combination of higher capital costs, lower conversion efficiency, and a generally higher feedstock cost when the required electricity input is considered. A distributed electrolysis unit using grid-supplied electricity is estimated to have a production cost of $6.77 per kilogram of hydrogen when the assumed 70-percent capacity factor is considered. A central electrolysis unit operating at 90-percent capacity factor, with 30 percent of the power requirements coming from wind and 70 percent from the grid, is estimated to have a production cost roughly 15 percent higher than that of a distributed SMR plant.

Because electrolysis technologies generally have higher capital and operating and maintenance costs, the implied price for electricity would have to be lower to achieve cost parity with a fossil or biomass feedstock.

Source: U.S. Energy Information Administration

Supply

Hydrogen is the most abundant element in the universe. Yet, there is effectively no natural hydrogen gas resource on Earth. Hydrogen gas is the smallest and lightest of all molecules. When released, it quickly rises to the upper atmosphere and dissipates, leaving virtually no hydrogen gas on the Earth’s surface. Because hydrogen gas must be manufactured from feedstocks that contain hydrogen compounds, it is considered to be an energy carrier, like electricity, rather than a primary energy resource.

Currently, the main sources of hydrogen are hydrocarbon feedstocks such as natural gas, coal, and petroleum; however, some of those feedstocks also produce CO2. Thus, to provide overall emission savings, greenhouse gas (GHG) emissions must be mitigated during hydrogen production through CCS (carbon capture and storage) or similar technology, during end use through comparatively greater vehicle efficiency, or at other stages in the life cycle of the hydrogen fuel source. It is generally recognized that demand is not static and the accessibility of resources may be problematic. Also, the costs for addressing CO2 and other GHG emissions may increase, which could deter the full utilization of fossil fuels as a primary energy source for a hydrogen economy unless suitable mitigation measures are employed.

Another source for hydrogen production is electrolysis of water. For decades, the National Aeronautics and Space Administration (NASA) has used this process in hydrogen fuel cells to produce both power and water for its astronauts in space. However, hydrogen production from conventional grid-based electricity is an expensive process, as discussed below, and at present it is the least carbon-neutral method for hydrogen production, given that more than 49 percent of U.S. electricity generation in 2007 was from coal-fired power plants. Reducing costs and emission impacts may be achievable through the application of CO2 mitigation measures for existing electricity generation technologies or through breakthroughs in advanced electrolysis technologies.

The construction of new renewable generation capacity for the exclusive purpose of producing hydrogen from electrolysis is unlikely to be desirable from an investment perspective if, in order to make the resulting hydrogen competitive, the cost of the electricity is required to be less than the wholesale price at which that electricity could be sold to the grid.

Under a CO2-constrained scenario, large amounts of existing coal-fired capacity are likely to be retired, and new nuclear and renewable generators are likely to be added, to meet the CO2 emissions target. Because a CO2-constrained scenario is defined by policies that achieve a targeted level of CO2 emission reductions, any grid-based power production would already have those target CO2 emission levels factored into prices, with wind, biomass, and other power sources having been rewarded for their contributions, and higher CO2-emitting technologies having been penalized, as appropriate.

Source: U.S. Energy Information Administration

Greenhouse gas volumes at record level in 2012

November 6, 2013

At a news conference presenting the annual Greenhouse Gas Bulletin, Secretary General Michel Jarraud of the United Nations’ World Meteorological Organization (WMO) said that the agency has determined that volumes of greenhouse gases blamed for climate change hit a new record in 2012. “The trend is accelerating,” he said, “with year on year increases since 2010.” The volume of carbon dioxide, or CO2, the primary greenhouse gas emitted by human activities, grew faster in 2012 than in the previous decade, reaching 393.1 parts per million (ppm), 41 percent above the pre-industrial level. Its concentration in the atmosphere grew 2.2 ppm, higher than the average of 2.02 ppm over the past 10 years and the highest in over 800,000 years.

At this pace, in 2020 greenhouse gas emissions will exceed the maximum needed to contain global warming below 2 degrees by 8-12 billion tons; as a result, the 2 degree mark will likely be reached in mid-century.

“The increase in CO2 is mostly due to human activities,” Jarraud said. “The actions we take or don’t take now will have consequences for a very, very long period.”

It’s time to act.

Man-Cession

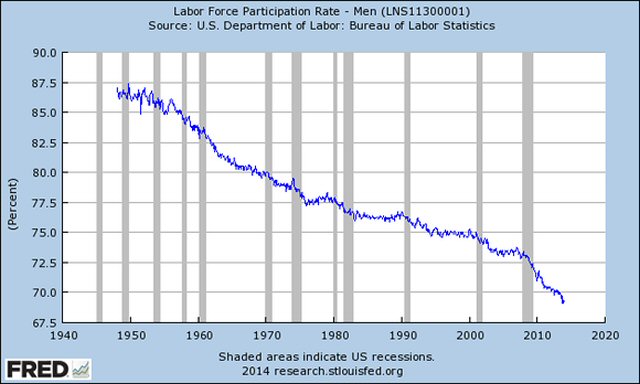
Labor Participation - Men 2014


In the mid 1950s, nearly every man in his prime working years was in the labor force, a category that includes both those who are employed and those actively applying for jobs. Early in 1956 the “participation rate” for men ages 25 to 54 stood at 97.7%. By late 2012 it had declined to a post-war record low of 88.4%.

Where did they go? Some went into prison. Others are on disability or can’t find jobs in occupations that are now obsolete, exported, or taken over by women, who (still) get paid less for the same work.

The trend is especially pronounced among the less educated. As the available blue-collar jobs in manufacturing, production and other fields traditionally dominated by men without college diplomas declined, many were left behind. But men with college degrees are leaving, too. The participation rate of those older than 25 and holding at least a bachelor’s degree fell to 80.2% in May 2013, down from 87.2% in 1992.

The economic cycles since World War II have failed to stem this downward slide, even when the unemployment rate hit a 30-year low in the early 2000s. The Great Recession accelerated the trend, pushing the participation rate for men in their prime working years below 90% for the first time.

Here’s a breakdown of the reasons why men are dropping out of the labor force.

Prison

A growing number of men have served time in jail, which makes it much harder to be accepted for a job once they complete their sentences. 1.2% of white men and 9% of black men born just after World War II went to jail prior to 2004. In contrast, for those born 30 years later, the rates were 3.3% and 20.7% respectively.

Disability

More men have been pouring into the federal disability system, especially in recent years, when the Great Recession and its aftermath pushed up the national unemployment rate. According to data from the National Academy of Social Insurance, in 1982 around 1.9% of working-age men were receiving disability benefits. By 2012, that number had climbed to 3.1%. Once on the disability rolls, few people get off. Only 2.2% did so in the first quarter of 2013.

Lack of education

A few decades ago, men could graduate high school and make a decent living on a factory floor or at a construction job. As the labor market becomes more skilled, those guys are being left behind. For less than wealthy individuals, the already high (and increasing) cost of a college education that does not guarantee a job upon graduation means accepting responsibility for non-dischargeable debt, equal to or higher than the mortgage on a home. Social networks are full of tales alerting them to the consequences of being forced to accept minimum wage jobs: the despair of little or no disposable income that leaves them unable to compete for the affection of women who, incidentally, may earn far more than they.

Competition from women

According to data in Wayward Sons, in the 1960s more men than women were enrolling in and completing college. Women born in 1975 were roughly 17% more likely than their male counterparts to attend college and nearly 23% more likely to complete a four-year degree.

Obviously, many non-college men refuse to work in low-paying jobs. The decline of men in the labor force has broad, deep ramifications for families, taxpayers and the economy. Fewer employed men mean higher entitlements, reduced tax revenue, a potential for higher crime rates, and more unstable relationships with single-parent households. Perhaps the single most important consequence is that these unemployed adult men are also voters. Naturally they may favor candidates that believe that it is the government’s responsibility to see to it that well-paying, permanent jobs are plentiful.

Depletion And Pollution

Depletion and Pollution of Water

The world is facing extraordinarily serious fresh water depletion and pollution, both exacerbated by ever rising demand. Over the next 40 years estimates are that demand for water will rise 50% while demand for food will rise 70%, all in the same period that we’ll be forced to confront climate change and depletion of rivers and aquifers.

Farming (and to a lesser extent, other human activities) are the main culprits. Growing food for an average human diet requires an estimated 320 gallons of water a day. For an average American diet the number is closer to 900 gallons of water a day. Agriculture depends on water, consuming fully 70% of the world’s fresh water. To produce that water, we’re draining rivers, lakes, and fossil water aquifers at an unsustainable rate. Runoffs of pesticides and fertilizers are the largest sources of pollution in US lakes and rivers, directly responsible for an 8,000 square mile dead zone in the Gulf of Mexico.

Beneath the American high plains of Nebraska, Kansas, northern Texas, and five other states lies the Ogallala Aquifer, a giant underground reservoir of fresh water that farms and people in the region depend on. Ogallala is full of ‘fossil water’ – the remnants of the glaciers and ice sheets that retreated from this area more than 10,000 years ago, melting and filling underwater basins as they went. That fossil water is used to irrigate 27% of the farmland in the United States. In two months the water we withdraw from Ogallala is enough to fill a cube a mile on a side. As a result, the aquifer’s water level is dropping, in some places as fast as three feet per year. On current course and speed, it will run dry before this century is over, and possibly much sooner.

The rate at which we consume water – particularly for agriculture – exceeds the rate at which we can capture it from rain or from sustainable withdrawals from rivers.

The Indus River Valley aquifer is being drained at a rate of 20 cubic kilometers a year. Water tables in Gujarat province are falling by as much as 20 feet a year. The giant North China Plain aquifer, which provides irrigation for fields that feed hundreds of millions, has been found to drop as much as 10 feet in a single year. A World Bank report cautions that in some places in northern China, wells have to be drilled nearly half a mile deep to find fresh water. Hebei province, one of five atop the aquifer, has seen more than 900 of its 1,052 lakes dry up and disappear due to dropping water tables. In Mexico’s agricultural state of Guanajuato, the water table is dropping by 6 feet a year. In north eastern Iran, it’s dropping by as much as 10 feet a year.

Water is being withdrawn from rivers as well. Seasonal water levels are dropping on China’s Yellow River, on the Nile in Egypt, on the Indus as far north as Pakistan, and on the Rio Grande in the US. Parts of the Colorado River are a stunning 130 feet below their historic levels. The river no longer reaches the sea. Nor does the Yellow River or dozens of others around the world that have been tapped for irrigation. The rivers that flow through Central Asia have been so massively drained for agriculture that the vast Aral Sea they once fed, once the fourth largest freshwater lake in the world, is now little more than a dry, salty lake bed, its former shore dotted with abandoned fishing villages and the bones of beached boats.

70% of the world’s surface is covered in water. Yet the vast majority of that water – around 97% of it – is salt water. Another 2% is locked up in ice caps and glaciers. Only around 1% of the world’s water is fresh, and of that, humanity can only easily access about a tenth, or 0.1%.

If we could efficiently convert salt water to fresh, we’d have access to a vast supply of water to use in growing crops and sustaining human civilization. For decades, desalination has been considered a deeply anti-environmental process, primarily because it consumes enormous amounts of energy and releases huge amounts of greenhouse gases.

However, with sufficient cheap renewable energy from technological discoveries, our featured solution could create water supplies many times larger than any projected human need.

Demographic Change And Racial Inequalities

07/14/2013

The success of minority children who will form a new majority is crucial to future U.S. economic competitiveness.

A wave of immigration, the aging of non-Hispanic white women beyond child-bearing years and a new baby boom are diminishing the proportion of children who are white. Already, half of U.S. children younger than 1 are Hispanic, black, Asian, Native American or of mixed races.

“A lot of people think demographics alone will bring about change and it won’t,” said Gail Christopher, who heads the W.K. Kellogg Foundation’s America Healing project on racial equity. “If attitudes and behaviors don’t change, demographics will just mean we’ll have a majority population that is low-income, improperly educated, disproportionately incarcerated with greater health disparities.”

In 2010, 39.4 percent of black children, 34 percent of Hispanic children and 38 percent of American Indian and Alaska Native children lived in poverty, defined as an annual income of $22,113 that year for a family of four. That compares with about 18 percent of white, non-Hispanic children, according to Census Bureau’s 2011 American Community Survey.

Asian children overall fare better, with 13.5 percent living in poverty, the survey said.

The overrepresentation of minority children among the poor is not new. What is new is that minority children will, in the not-too-distant future, form the core of the nation’s workforce, and their taxes will be depended on to keep solvent entitlement programs for the elderly.

Based on where things stand for nonwhite children today, it’s not hard to make some educated guesses about what the future holds for the youngest of America’s children who already are a majority of their age group, said Sam Fulwood III, a senior fellow at the Center for American Progress.

The recent recession worsened conditions for many children, but minorities were hard hit and are having more difficulty recovering.

The Pew Charitable Trusts found that, from 1999 to 2009, 23 percent of black families and 27 percent of Hispanic families experienced long-term unemployment, compared with 11 percent of white families. Pew Research Center, a subsidiary, found that the median wealth of white households is 20 times that of black households and 18 times that of Hispanic households.

That means more minority families end up in poor neighborhoods with underperforming school systems, leading to lower graduation rates and lower lifetime earnings, said Leonard Greenhalgh, a professor of management at Tuck School of Business at Dartmouth College in New Hampshire.

“You are looking at the future workforce of the United States — what we need to be competitive against rival economies such as India and China, and we are not educating the largest, fastest growing percentage of the U.S. workforce, so as a nation we lose competitive advantage,” Greenhalgh said.

It all starts with preschool, where overall enrollment has been increasing but Hispanic children are less likely to be included. Of Hispanic children ages 3 to 5 in the U.S., 13.4 percent were enrolled in full-day public or private nursery school in 2011, according to data from the National Center for Education Statistics.

That compares with 25.8 percent of black children enrolled in full-day preschool and 18.1 percent of white children. But already, Hispanics are one-quarter of students enrolled in public schools.

Compounding the issue, experts say, is immigration status. About 4.5 million children of all races born in the U.S. have at least one parent not legally in the U.S., according to the Pew Hispanic Center. More than two-thirds of impoverished Latino children are the children of at least one immigrant parent, the center reported.

The picture isn’t all bleak. History and recent data show improvements for the next generations of immigrant families.

The Pew Research Center found second-generation Americans, some 20 million U.S.-born children of 20th century immigrants, are better off than their immigrant parents. They have higher incomes, more graduate from college and are homeowners and fewer live in poverty, the study found.

Many experts on low-income children see good health as one more building block for education and prosperity. Children are less likely to learn if they are ill and missing school and unable to see a doctor.

In 2011, about 94 percent of black children, 92.3 percent of Asian/Native Hawaiian and Pacific Islander children and 95 percent of white children had health insurance coverage, while 87.2 percent of Hispanic children and 83.4 percent of American Indian and Alaska Native children had some form of health insurance coverage, according to a study by Georgetown University’s Center for Children and Families.

The numbers of uninsured children are at a historic low — just 7.5 percent, said Joan Alker, the center’s executive director.

While 73.1 percent of white children had private coverage, more than half of black and Hispanic children got health care through Medicaid and the Children’s Health Insurance Programs and similar federal and state subsidized programs, the Federal Interagency Forum on Child and Family Statistics reported.

Unrecognizable Planet?

Planet ‘unrecognizable’ by 2050 – Experts

2/20/2011

A growing, more affluent population competing for ever scarcer resources could make for an “unrecognizable” world by 2050, researchers warned at a major US science conference Sunday.

The United Nations has predicted the global population will reach seven billion this year, and climb to nine billion by 2050, “with almost all of the growth occurring in poor countries, particularly Africa and South Asia,” said John Bongaarts of the non-profit Population Council.

To feed all those mouths, “we will need to produce as much food in the next 40 years as we have in the last 8,000,” said Jason Clay of the World Wildlife Fund at the annual meeting of the American Association for the Advancement of Science (AAAS).

“By 2050 we will not have a planet left that is recognizable” if current trends continue, Clay said.

The swelling population will exacerbate problems, such as resource depletion, particularly water, which is projected to be severely impacted by global warming.

But incomes are also expected to rise over the next 40 years — tripling globally and quintupling in developing nations — and add more strain to global food supplies.

People tend to move up the food chain as their incomes rise, consuming more meat than they might have when they made less money, the experts said.

It takes around seven pounds (3.4 kilograms) of grain to produce a pound of meat, and around three to four pounds of grain to produce a pound of cheese or eggs, experts told AFP.

“More people, more money, more consumption, but the same planet,” Clay said, urging scientists and governments to start making changes now to how food is produced.

WordPress theme: Kippis 1.15
Translate »